Annotab Studio 2.0.0 is now live
Evaluation metrics for segmentation
Evaluation metrics for segmentation
Evaluation metrics for segmentation
Evaluation metrics for segmentation
Published by

Dao Pham
on
Dec 4, 2023
under
Computer Vision
Published by
Dao Pham
on
Dec 4, 2023
under
Computer Vision
Published by
Dao Pham
on
Dec 4, 2023
under
Computer Vision
Published by
Dao Pham
on
Dec 4, 2023
under
Computer Vision
ON THIS PAGE
Tl;dr
Delve into the intricacies of computer vision evaluation metrics in segmentation, where the interplay of ground truth and model predictions determines precision.
Tl;dr
Delve into the intricacies of computer vision evaluation metrics in segmentation, where the interplay of ground truth and model predictions determines precision.
Tl;dr
Delve into the intricacies of computer vision evaluation metrics in segmentation, where the interplay of ground truth and model predictions determines precision.
Tl;dr
Delve into the intricacies of computer vision evaluation metrics in segmentation, where the interplay of ground truth and model predictions determines precision.

Introduction
In computer vision, conceptualizing image annotation-based measurements, particularly in the context of segmentation, the interplay of ground truth and model predictions determines precision. In this article, let's unpack the nuances of True/False Positives and Negatives, and navigate through key metrics that offer a meticulous examination of a segmentation model's performance.
True/False Positive and True/False Negative
In the context of segmentation, ground truth is the object of interest (the target), and detection (segmentation area) is the region that the model predicts. Imagine that your ground truth and the result of the model are the images in Figure 1.

Figure 1: Ground truth (left) and Detection (right)
Based on the two definitions of ground truth and detection, we have four situations that can happen:
True positive (TP): Pixels correctly segmented by the model as belonging to the object, and really being in the object (aligning with the ground truth).
False positive (FP): Pixels wrongly segmented by the model as part of the object, despite not being so in reality.
True negatives (TN): Pixels outside the object in both the ground truth and the model’s result.
False negative (FN): Pixels truly belonging to the object, but the model misses in segmenting them.
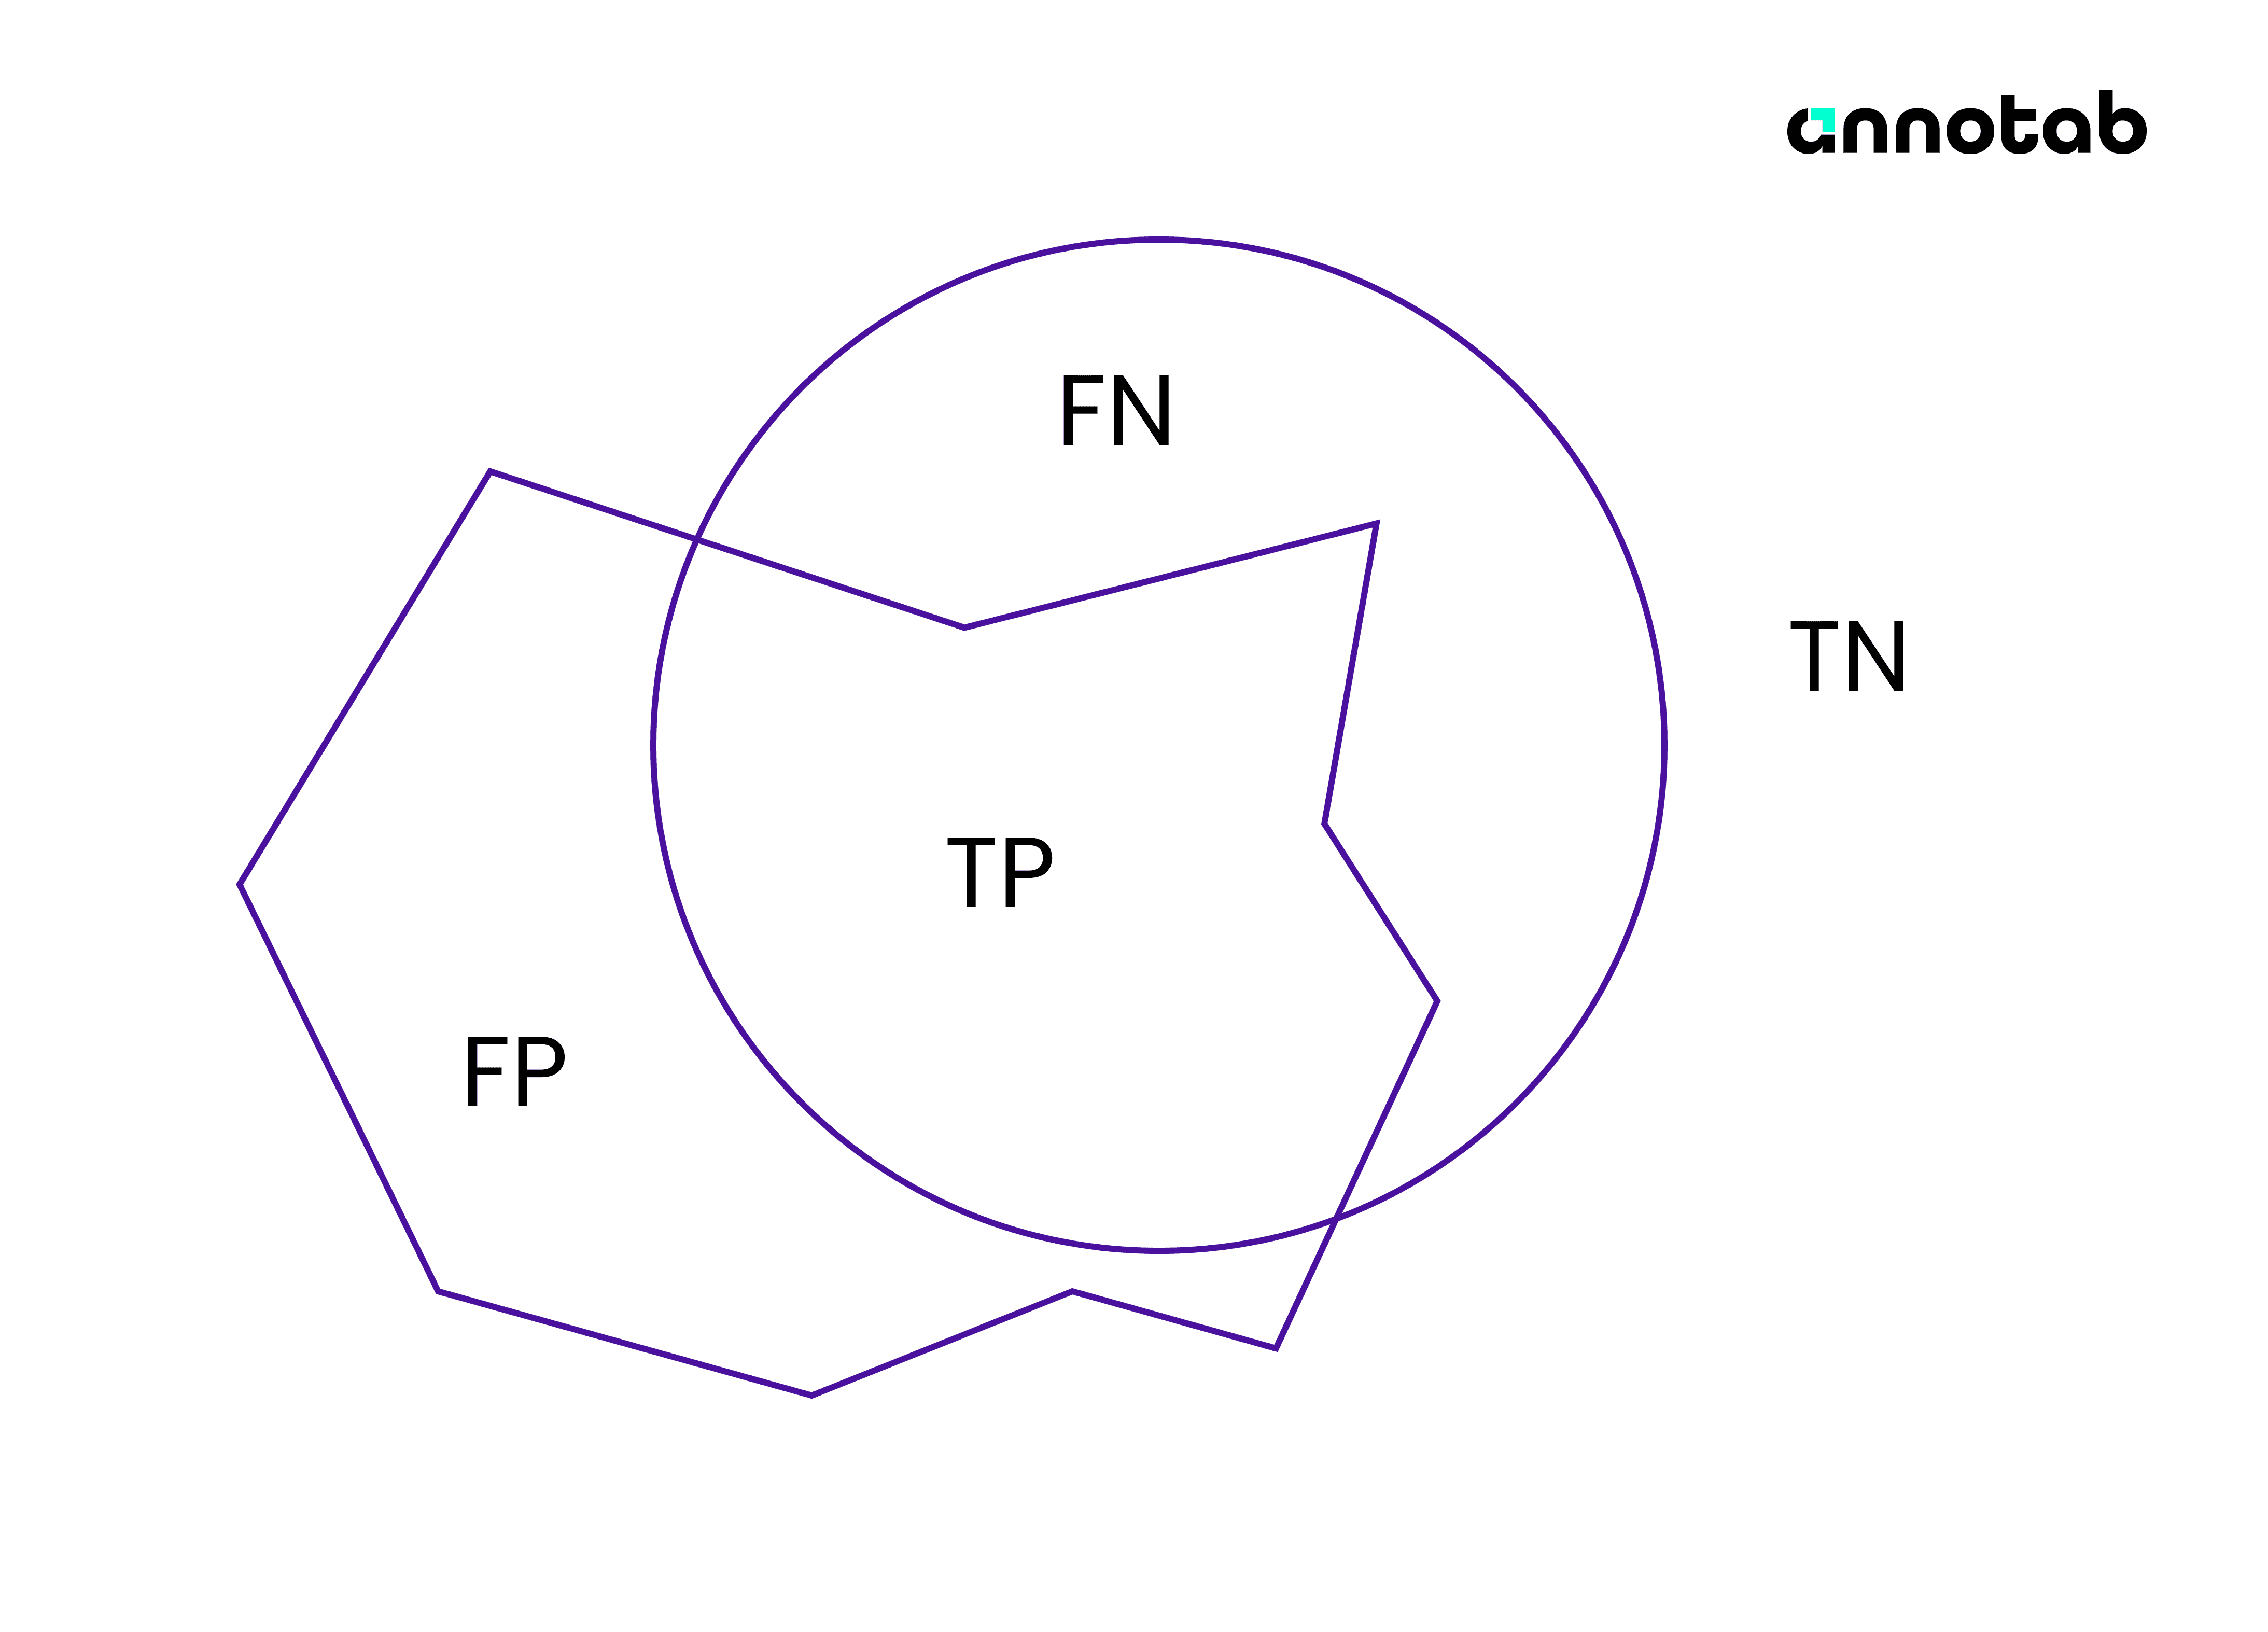
Figure 2: Visualization of True Positive (TP), False Positive (FP), True Negative (TN), and False Negative (FN) in context of segmentation
True/False Positive and True/False Negative
In the context of segmentation, ground truth is the object of interest (the target), and detection (segmentation area) is the region that the model predicts. Imagine that your ground truth and the result of the model are the images in Figure 1.
Figure 1: Ground truth (left) and Detection (right)
Based on the two definitions of ground truth and detection, we have four situations that can happen:
True positive (TP): Pixels correctly segmented by the model as belonging to the object, and really being in the object (aligning with the ground truth).
False positive (FP): Pixels wrongly segmented by the model as part of the object, despite not being so in reality.
True negatives (TN): Pixels outside the object in both the ground truth and the model’s result.
False negative (FN): Pixels truly belonging to the object, but the model misses in segmenting them.
Figure 2: Visualization of True Positive (TP), False Positive (FP), True Negative (TN), and False Negative (FN) in context of segmentation
Evaluation Metrics
The 3 metrics: Recall, Miss Detection Rate, and False Detection Rate are often used to assess the performance of the segmentation model. Let’s take a deep look at each measurement.
Recall (True Positive Rate)
Recall, or True Positive Rate tells us how well the model successfully segments the object of interest:
For each object, this is the ratio between the correct area (aligning with the ground truth) of the segmentation model, and the total ground truth area of the object. The mean Recall is averaged by all Recall values.
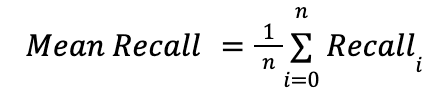
(with n as the total number of objects)
A higher Recall only represents that the model has a large overlap between the ground truth and the detection area, while a lower recall suggests that the model is missing many relevant parts of the object. So, to identify the reliability, we not only used the Recall but also required other 2 metrics to know how much we missed the ground truth and how much we wrongly segmented.
Miss Detection Rate (False Negative Rate)
The Miss Detection Rate, also known as the False Negative Rate, quantifies the proportion of parts that are not detected or missed by the model. In other words, they are the regions or pixels of objects that are wrongly segmented into the background.
It is expressed as a ratio of missed detection area to the total ground truth area of the object. For each object, we have:
The mean Miss Detection Rate is also averaged by all Miss Detection Rate values:

(with n as the total number of objects)
A higher Miss Detection Rate indicates a higher rate of failure in segmenting objects of interest, suggesting lower performance. Lower values of the Miss Detection Rate are desirable, as they indicate more accurate performance due to fewer misses in finding relevant parts of the object.
False Detection Rate (False Positive Rate)
False Detection Rate is a metric that evaluates the performance of the model by quantifying the percentage of regions or pixels that are incorrectly segmented as part of the object of interest. Basically, this rate tells us how badly the model includes non-object regions in its result.
The False Detection Rate for each object is then calculated as:

Similar to the two metrics above, we obtain the mean False Detection Rate by averaging all False Detection Rate values:
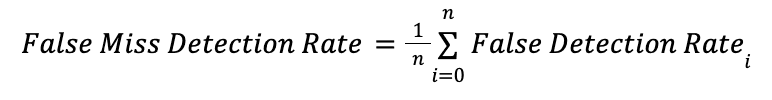
(with n as the total number of objects)
A higher False Detection Rate suggests a higher rate of incorrectly identifying non-object regions as part of the object. It means the model is less effective when the goal is that we only want to find relevant parts of the object, because it contains many non-object regions (false detection regions). On the contrary, lower values of the False Detection Rate are preferable, indicating a more accurate segmentation with fewer non-object regions.
In conclusion, understanding these metrics provides a comprehensive assessment of a segmentation model's reliability, accuracy, and effectiveness.
Evaluation Metrics
The 3 metrics: Recall, Miss Detection Rate, and False Detection Rate are often used to assess the performance of the segmentation model. Let’s take a deep look at each measurement.
Recall (True Positive Rate)
Recall, or True Positive Rate tells us how well the model successfully segments the object of interest:
For each object, this is the ratio between the correct area (aligning with the ground truth) of the segmentation model, and the total ground truth area of the object. The mean Recall is averaged by all Recall values.
(with n as the total number of objects)
A higher Recall only represents that the model has a large overlap between the ground truth and the detection area, while a lower recall suggests that the model is missing many relevant parts of the object. So, to identify the reliability, we not only used the Recall but also required other 2 metrics to know how much we missed the ground truth and how much we wrongly segmented.
Miss Detection Rate (False Negative Rate)
The Miss Detection Rate, also known as the False Negative Rate, quantifies the proportion of parts that are not detected or missed by the model. In other words, they are the regions or pixels of objects that are wrongly segmented into the background.
It is expressed as a ratio of missed detection area to the total ground truth area of the object. For each object, we have:
The mean Miss Detection Rate is also averaged by all Miss Detection Rate values:
(with n as the total number of objects)
A higher Miss Detection Rate indicates a higher rate of failure in segmenting objects of interest, suggesting lower performance. Lower values of the Miss Detection Rate are desirable, as they indicate more accurate performance due to fewer misses in finding relevant parts of the object.
False Detection Rate (False Positive Rate)
False Detection Rate is a metric that evaluates the performance of the model by quantifying the percentage of regions or pixels that are incorrectly segmented as part of the object of interest. Basically, this rate tells us how badly the model includes non-object regions in its result.
The False Detection Rate for each object is then calculated as:
Similar to the two metrics above, we obtain the mean False Detection Rate by averaging all False Detection Rate values:
(with n as the total number of objects)
A higher False Detection Rate suggests a higher rate of incorrectly identifying non-object regions as part of the object. It means the model is less effective when the goal is that we only want to find relevant parts of the object, because it contains many non-object regions (false detection regions). On the contrary, lower values of the False Detection Rate are preferable, indicating a more accurate segmentation with fewer non-object regions.
In conclusion, understanding these metrics provides a comprehensive assessment of a segmentation model's reliability, accuracy, and effectiveness.
Dao Pham
Product Developer
#TechEnthusiast #AIProductDeveloper
Dao Pham
Product Developer
#TechEnthusiast #AIProductDeveloper
Dao Pham
Product Developer
#TechEnthusiast #AIProductDeveloper
Dao Pham
Product Developer
#TechEnthusiast #AIProductDeveloper